David Wright is back, or rather he’s still back. Wright, who batted .311/.394/.534 (OPS+ 141) from 2005-08 (age 22-25), slumped to .284/.364/.463 (OPS+ 124) from 2009-11, the first three years in the new Citi Field in what should have been his prime hitting age, 26-28. But over the 2012-13 seasons so far, he’s hitting .307/.396/.497 (OPS+ 146), reclaiming his status as an elite player.
A major factor in both turnarounds has been Wright’s strikeout rate. From 2005-08, Wright averaged walks in 11.8% of his plate appearances, strikeouts in 16.6%. From 2009-11, the walk rate slumped slightly to 11.2%, but the K rate ballooned to 22.9%. Strikeouts are not much worse than any other out, but when a player suddenly starts striking out a lot more, that’s usually a bad sign. Since the start of 2012, however, Wright is back to a BB/K rate of 12.8% walks, 16.5% strikeouts.
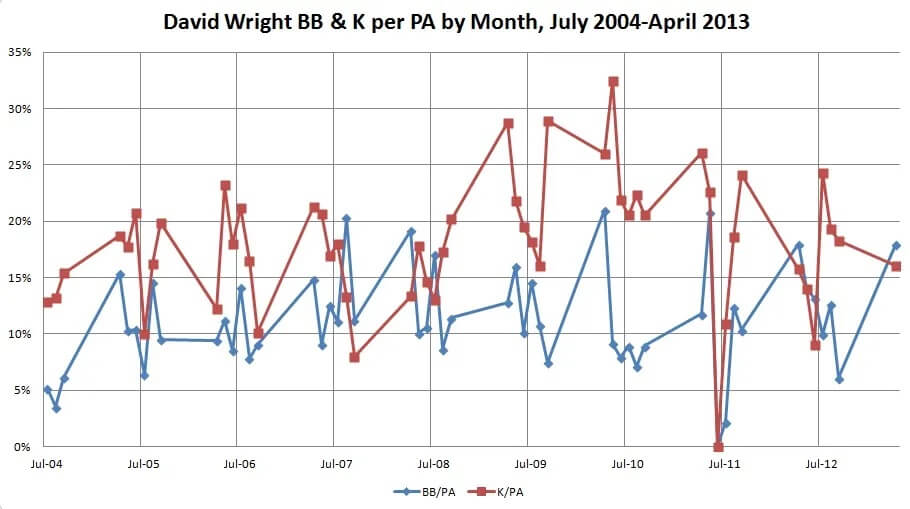
When you break it out by month, it’s hard to avoid the conclusion that Wright was particularly badly affected by his August 15, 2009 beaning, which caused him to miss the rest of that month; while his K rate was already up in April-May 2009 (14.6% BB, 24.9% K, mostly due to adjusting to an unfriendly new home park – 11.2% BB, 31.2% K in home games those two months, 18.3% BB, 18.3% K in road games), he’d been whittling it down the rest of that season (12.0% BB, 18.3% K in June-August 2009), before being beaned by Matt Cain. From his return in September 2009 through May 2010, Wright averaged an unsightly 8.7% BB and 25.1% K rate. It took a while to gradually get that back to a more normal (for him) ratio.
Last season, Wright started with great progress in cutting his strikeouts, but they spiked in July. Combined with a September spike in 2011, that suggests that, as Wright gets older, he may be prone to getting his swing out of whack as fatigue and injuries set in (although recall that last year he was hitting with a broken finger in April). So, it’s possible that this year’s low strikeout rate will drift a bit as the year goes on. But on the whole, the pattern over Wright’s career is that keeping his strikeouts under control is key to his productivity. Here’s the monthly breakdown over his career:
| Month | PA | BB | K | BB/PA | K/PA |
|---|---|---|---|---|---|
| Jul-04 | 39 | 2 | 5 | 5% | 13% |
| Aug-04 | 114 | 4 | 15 | 4% | 13% |
| Sep-04 | 130 | 8 | 20 | 6% | 15% |
| Apr-05 | 91 | 14 | 17 | 15% | 19% |
| May-05 | 107 | 11 | 19 | 10% | 18% |
| Jun-05 | 106 | 11 | 22 | 10% | 21% |
| Jul-05 | 110 | 7 | 11 | 6% | 10% |
| Aug-05 | 117 | 17 | 19 | 15% | 16% |
| Sep-05 | 126 | 12 | 25 | 10% | 20% |
| Apr-06 | 106 | 10 | 13 | 9% | 12% |
| May-06 | 125 | 14 | 29 | 11% | 23% |
| Jun-06 | 117 | 10 | 21 | 9% | 18% |
| Jul-06 | 99 | 14 | 21 | 14% | 21% |
| Aug-06 | 115 | 9 | 19 | 8% | 17% |
| Sep-06 | 99 | 9 | 10 | 9% | 10% |
| Apr-07 | 108 | 16 | 23 | 15% | 21% |
| May-07 | 121 | 11 | 25 | 9% | 21% |
| Jun-07 | 112 | 14 | 19 | 13% | 17% |
| Jul-07 | 117 | 13 | 21 | 11% | 18% |
| Aug-07 | 128 | 26 | 17 | 20% | 13% |
| Sep-07 | 125 | 14 | 10 | 11% | 8% |
| Apr-08 | 120 | 23 | 16 | 19% | 13% |
| May-08 | 129 | 13 | 23 | 10% | 18% |
| Jun-08 | 123 | 13 | 18 | 11% | 15% |
| Jul-08 | 123 | 21 | 16 | 17% | 13% |
| Aug-08 | 127 | 11 | 22 | 9% | 17% |
| Sep-08 | 114 | 13 | 23 | 11% | 20% |
| Apr-09 | 94 | 12 | 27 | 13% | 29% |
| May-09 | 119 | 19 | 26 | 16% | 22% |
| Jun-09 | 118 | 12 | 23 | 10% | 19% |
| Jul-09 | 110 | 16 | 20 | 15% | 18% |
| Aug-09 | 56 | 6 | 9 | 11% | 16% |
| Sep-09 | 121 | 9 | 35 | 7% | 29% |
| Apr-10 | 100 | 21 | 26 | 21% | 26% |
| May-10 | 120 | 11 | 39 | 9% | 33% |
| Jun-10 | 114 | 9 | 25 | 8% | 22% |
| Jul-10 | 112 | 10 | 23 | 9% | 21% |
| Aug-10 | 112 | 8 | 25 | 7% | 22% |
| Sep-10 | 112 | 10 | 23 | 9% | 21% |
| Apr-11 | 119 | 14 | 31 | 12% | 26% |
| May-11 | 53 | 11 | 12 | 21% | 23% |
| Jun-11 | 0 | 0 | 0 | 0 | 0 |
| Jul-11 | 46 | 1 | 5 | 2% | 11% |
| Aug-11 | 113 | 14 | 21 | 12% | 19% |
| Sep-11 | 116 | 12 | 28 | 10% | 24% |
| Apr-12 | 89 | 16 | 14 | 18% | 16% |
| May-12 | 114 | 16 | 16 | 14% | 14% |
| Jun-12 | 122 | 16 | 11 | 13% | 9% |
| Jul-12 | 111 | 11 | 27 | 10% | 24% |
| Aug-12 | 119 | 15 | 23 | 13% | 19% |
| Sep-12 | 115 | 7 | 21 | 6% | 18% |
| Apr-13 | 106 | 19 | 17 | 18% | 16% |
I put the month-by-month graph below the fold because it’s very wide.