
RS: Mid-September Polls Are Not The Last Word On Senate Races
The perennial question about election polls is back again, if ever it left: how far can we trust them? Should we disregard all other evidence but what the current polling of individual Senate races tells us – which is, at this writing, that if the election was held today, Republicans would gain 6 seats in the Senate to hold a narrow 51-48 majority? As usual, a little historical perspective is in order. It is mid-September, with just over seven weeks to Election Day, and as discussed below, all the fundamental signs show that this is at least a mild Republican “wave” year. A review of the mid-September polls over the last six Senate election cycles, all of which ended in at least a mild “wave” for one party, shows that it is common for the “wave party” to win a few races in which it trailed in mid-September – sometimes more than a few races, and sometimes races in which there appeared to be substantial leads, and most frequently against the other party’s incumbents. Whereas it is very uncommon for the wave party to lose a polling lead, even a slim one, after mid-September – it has happened only three times, one of those was a tied race rather than a lead, and another involved the non-wave party replacing its candidate on the ballot with a better candidate. If these historical patterns hold in 2014, we would therefore expect Republicans to win all the races in which they currently lead plus two to four races in which they are currently behind, netting a gain of 8 to 10 Senate seats.
The Mid-September Polls: Still Waiting For The Wave
When I last reviewed the Senate races in late June, the picture we saw was that Republicans had largely locked up three races for open seats currently held by Democrats – in Montana, South Dakota, and West Virginia – and locked down the one GOP Senate seat in deep-blue territory, in Maine. That left nine heavily contested seats, mostly in red or purple states (plus blue Michigan, the toughest race) and four other purple or blue state races in which the GOP had not yet become competitive, but retained hopes of bringing the race into its sights:
As I noted at the time, this left Republicans “waiting for the wave” – hoping that fundamental factors like low Obama job approval ratings and the shift from registered-voter polls to likely-voter polls would show a general, across-the-board movement that would tilt the field just enough in these races to pull Republicans ahead.
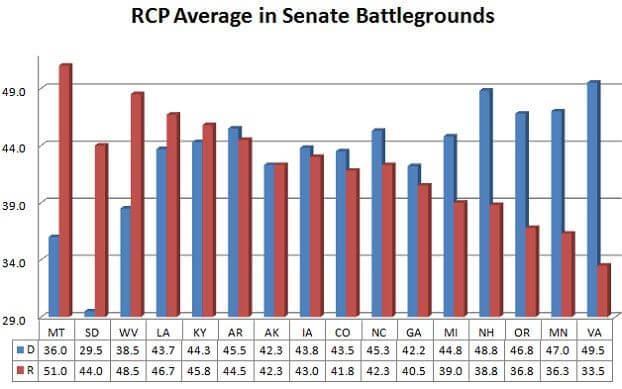
The battleground at present, as determined from this morning’s RealClearPolitics polling averages, is only slightly different – the Democrats are still in a good deal of trouble, but the lack of major movement would seem to suggest that a “wave” has yet to surface:
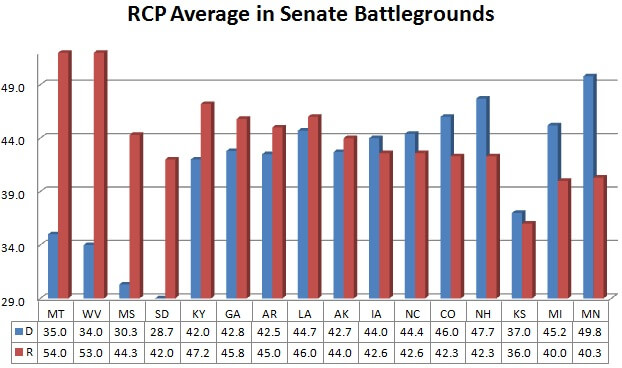
As before, I’m looking at head-to-head polling between Bill Cassidy and Mary Landrieu in Louisiana, since the main third candidate, Rob Maness, is likely to draw votes away from Cassidy but won’t help Landrieu avoid a runoff, so the more interesting question is who would win the runoff. The three locked-in pickups still look locked in, and Maine is still off the table. The two longest shots, in Oregon and Virginia, are not competitive – in fact, Republicans are actually closer now to making a race of Illinois and New Jersey than Oregon and Virginia (although both Dick Durbin and Cory Booker still have double-digit leads in traditionally blue states, so we would need to see further poll movement before declaring either of those states to actually be competitive). New Hampshire and Minnesota have tightened, but are not yet in the “hotly contested” bracket, while the GOP has fallen further behind in Michigan. In the Republican-held seats, David Perdue has opened a 3-point lead in Georgia and Mitch McConnell has gradually pulled to about 5 points ahead in Kentucky – a good lead, but no better than what Gary Peters in Michigan and Jeanne Shaheen in New Hampshire have on the Democratic side. Thad Cochran is well below 50, often dangerous territory for an incumbent, but he still has a 14 point lead and it’s still Mississippi, so he is even less likely to end up in a tight race at the end than Durbin or Booker. The wild card for now is Kansas, where the Democrats have thrown their support behind “independent” Greg Orman against the suddenly vulnerable Pat Roberts but have failed in their bid to get their own nominee, Chad Taylor, thrown off the ballot. It will be at least a week, maybe two, before we have a critical mass of polling in that race that post-dates Taylor’s attempted withdrawal. All of the remaining races feature leads of less than 4 points, four of them leads of less than two points, and in only three of the contested but not locked-up races is the leader at 47% or better (McConnell, Shaheen, and Al Franken). On the surface, therefore, what we have is a dogfight with a whole bunch of races that could still go either way.
The Fundamentals: The Tide Still Favors Republicans
But the recent history of Senate races says that a whole bunch of races will not go either way – it is more likely that a whole bunch of races will all go the same way, in the Republican direction. There’s been a lot of discussion about the meaning of the term “wave” election. Political scientists use their own somewhat precise definition of a “wave” election, and Sean Trende has reviewed the arguments under that rubric. If you define a wave in terms of political spin – a large enough election outcome to draw conclusions about some sort of voter mandate – then you need to set the bar and measure the final results against them. For those purposes, I would say the GOP has had a successful year if it picks up at least 7 Senate seats, net, and can claim a real “wave” if it picks up 8 or more, which would require it to not only run the table in Romney 2012 states (including the narrowly won North Carolina) but also break through in some of the Obama 2012 states like Iowa, Colorado, New Hampshire, Michigan, and/or Minnesota.
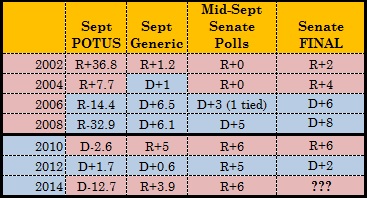
But for my purposes, I will use a simpler functional definition of a “wave,” one that covers each of the last six Senate election cycles and seems, from all the available evidence, to fit this one as well: a party has a “wave” election when the President’s approval ratings and generic Congressional ballot both favor it, it gains seats on net in both the Senate and House races, and it loses no more than two Senate seats it held going into Election Day. As we can see, by that definition, we had a Republican wave in 2002, 2004 and 2010, and a Democratic wave in 2006, 2008 and 2012, and should expect a Republican wave again in 2014:
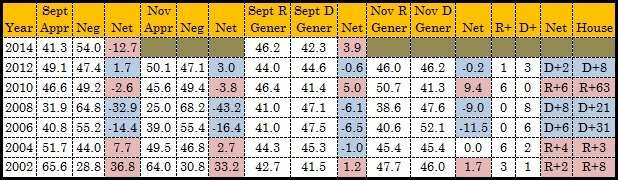
The only slight exception to the across-the-board wave dynamic in those elections is that the GOP trailed in the generic House ballot in mid-September 2004 and ended up tied on Election Day. And we see the same trend now: President Obama’s approval rating is double digits under water, and Republicans have opened a growing lead in the generic ballot.
If you project the election results just from these national fundamentals, you could take the view explained by Trende that the Senate races should mostly track the President’s approval rating and that Democrats’ current poll performance in the generic ballot and the Senate races may be close to its ceiling because Democratic candidates have locked up basically all the voters who approve of the President’s job performance, leaving a pool of undecideds who overwhelmingly disapprove of Obama and are thus likely to break against his party.
But what about the polls themselves? It would seem dangerous to disregard them. Josh Katz at the New York Times’ Upshot blog looks at some recent history and concludes that poll-based forecasts, while more accurate than fundamentals-based forecasts, are less accurate than forecasting models that incorporate both polls and fundamentals. Nate Silver looks at the individual polls in Governor, Senate and House races, and finds a significant amount of polling error even in the last three weeks of a campaign – with October polls in Senate races consistently off by an average of 4 or more points. 4 points is not a big deal in an uncompetitive race, but when we’re talking about races where the lead is 4 points or less, it’s a very big deal. Silver, however, confines his review to individual polls, and not averages:
It’s important to note that the accuracy of the average poll — what these figures describe — is not the same thing as the accuracy of the polling average. The polling average will cancel out some of the errors from individual polls provided that the misses come in opposite directions.
Let’s take a look, then, and see specifically how the final results compared to the polling averages as of mid-September for the last six cycles. For all of these, I will use the RCP average; I noted with an asterisk where I had to do my own estimating of an average (this was too pervasive to bother marking off in 2004 and 2002, as the averages were less sophisticated and available). The sample size is still not huge, but it’s more than just a couple of elections: I was able to track down polling in 87 at least moderately competitive races followed by RCP, out of more than 200 Senate elections in that period. Those 87 races include all the races that were seriously contested except for the three races won by a candidate running as at least a nominal independent in a three-way race (Angus King in 2012, Lisa Murkowski in 2010, and Joe Lieberman in 2006), which I excluded because those races tend to defy easy D vs R classification. We have a good cross-section of Senate cycles to work with here – every Senate seat came up at least twice, we have three general and three midterm elections, three Republican waves and three Democratic waves, three elections when the President was popular and three when the President was unpopular. (What may be harder to quantify with the data we have is the extent to which the predictive value of polls has been affected by the expansion of early voting in many states over this period to allow votes to be cast well before Election Day, but I do not believe any state allows early voting in September).
2002 to 2012: A Senate Odyssey
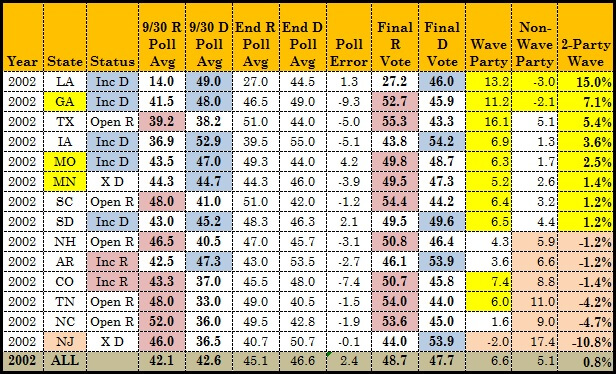
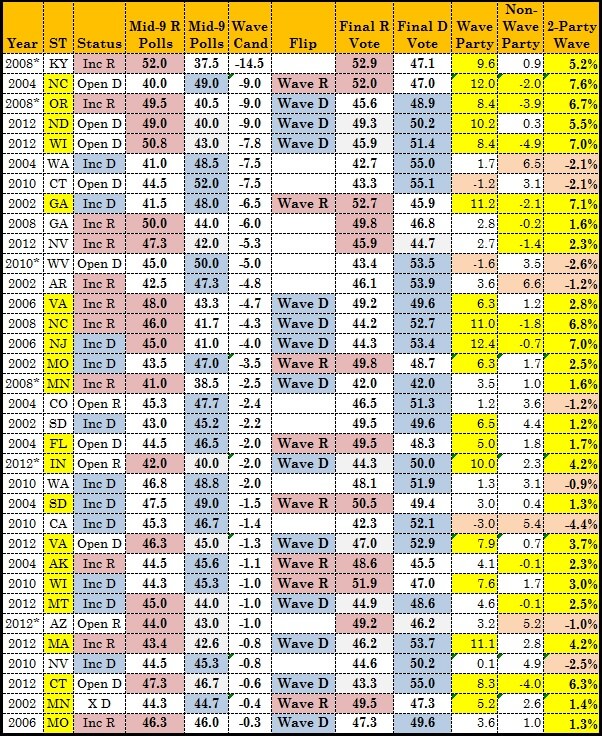
Working backward, let’s start with the 2012 election. I include here both the mid-September (where available, September 15) RCP average and the final RCP polling average, so you can compare how much of the accuracy or inaccuracy of the mid-September polls may be due to polling errors as opposed to subsequent movement in the electorate (the “poll error” column shows how far off the final poll average was from the result). The “2-Party Wave” column shows the swing in the 2-party vote from mid-September to the final election result. Thus, for example, a candidate who led 46-39 in mid-September is getting 54% of the two-party vote; if that candidate wins 51-49, she would be down 3% in the two-party vote. Another way of putting it is that a 2.5 point swing in the 2-party vote is, more or less, enough to wipe out a 5-point polling lead (I explained in my recent essay on presidential election history why the 2-party vote is a useful metric). I highlight movement towards the wave party in yellow, towards the non-wave party in light orange.
2012: Comparing September 15 Polls To November 6 Election Results
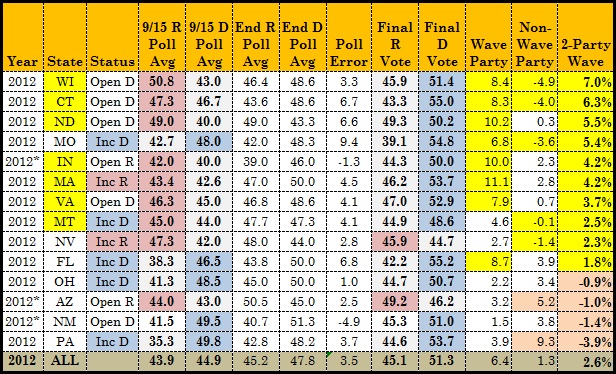
Three things jump out from this chart. One, Republican Senate candidates led in seven races at this point two years ago that they went on to lose, even though mid-September was right after the Democratic convention and thus while President Obama was still enjoying something of a post-convention “bounce.” Tommy Thompson had an 8-point lead and lost by 6, a 14-point swing (thus, a 7 point swing in the 2-party vote in the direction of the wave party). The Democrats didn’t lose a single race they led, and the biggest swing to the GOP was in the Pennsylvania Senate race, which went from a blowout to a 9-point loss. Of the seven states that flipped, four were carried by Obama in November, and two others were probably the result of bad polling – Republicans lost races in North Dakota and Montana, in which they led in the RCP poll average on Election Day. The other was Richard Mourdock in Indiana.
Two, there was an across-the-board 2-party swing of 2.6 points towards the Democrats, the largest in any of the races we’ll examine. That testifies to the strength of the Obama ground game, and suggests that the state-by-state polls, which did better than the national polls in the great polling debate of 2012 (more in my 3-part postmortem on 2012 polling here, here and here), were still playing catch-up in the Senate races in estimating what the final electorate would look like.
And three, if you look at the “Wave Party” column and the “Non-Wave Party” column, which subtract the September poll averages from the final results, you can see that most of the Democrats’ gains came from their candidates improving in the polls, rather than from the Republicans sagging. In other words, the late deciders broke for the wave party. That is the recurring trend in most of these elections.
2010: Comparing September 15 Polls To November 2 Election Results
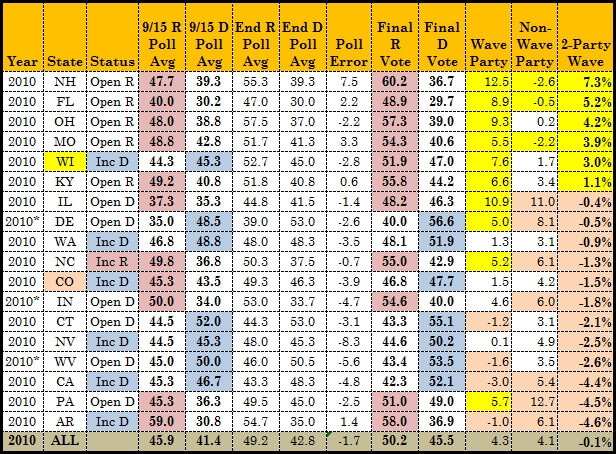
In 2010, unlike 2012, the wave was mostly baked into the polling cake by mid-September; most of the poll movement was Republican leaders pulling away, albeit even in races like Illinois where the GOP lead in mid-September was microscopic and the number of undecideds enormous. In Wisconsin, as in 2012, the race flipped with the wave after mid-September, with Ron Johnson pulling ahead of Russ Feingold (Wisconsin generally holds its primaries late, and turning out college students who arrive on campus in September is a big factor). Republicans did blow one race they led in mid-September (Ken Buck in Colorado, where there had been a nasty primary and the Governor’s race was imploding), and one where they trailed in mid-September but led on Election Day (Sharron Angle’s race against Harry Reid in Nevada).
2008: Comparing September 15 Polls To November 4 Election Results
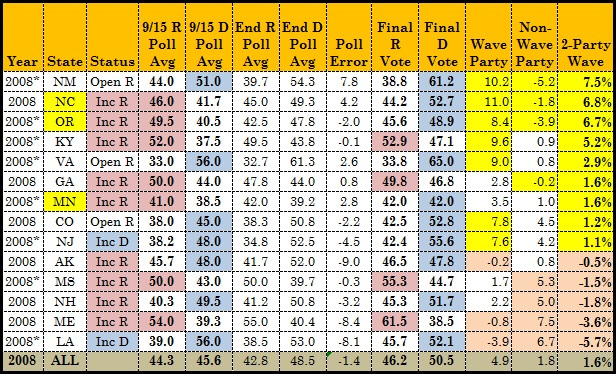
In 2008, we see a 1.6 point overall shift to the Democrats, and three races (all GOP incumbents) flipped in the Democrats’ direction after mid-September, all in states carried by Obama in the general election.
2006: Comparing September 20 Polls To November 7 Election Results
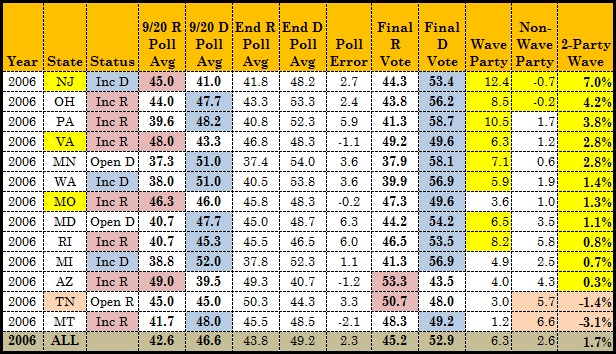
I used different dates than September 15 for 2002, 2004 and 2006 because those were the closest dates on which I could find the RCP poll page on the Wayback Machine. Again, we have three races flipping in the direction of the wave party, the Democrats, two of them Republican incumbents in Missouri and Virginia (the latter due in large part to George Allen’s “macaca” flap helping cost him his 5-point lead), the other the New Jersey Senate race where Tom Kean had led Democratic incumbent Bob Menendez by 4 but was stalled at 45. The one race that “flipped” in the GOP direction against the wave was in Tennessee, where Harold Ford had been tied in the polls in mid-September, but overall there was a 1.7 point movement in the 2-party vote towards the Democrats.
2004: Comparing September 16 Polls To November 2 Election Results
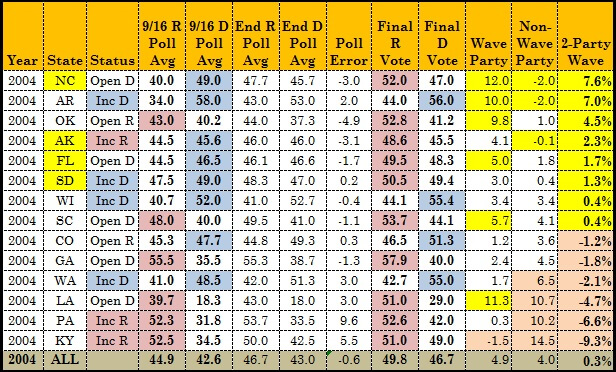
It’s hard to believe now that in 2004, when Republicans still held two Senate seats in Pennsylvania, Democrats were defending Senate seats in North Carolina, South Carolina, Georgia, Florida, Arkansas and Louisiana. Flips after mid-September rescued a Republican incumbent, Lisa Murkowski, in Alaska, buried the Senate Minority Leader, Tom Daschle, in South Dakota, and flipped open Democratic seats in North Carolina and Florida. Every Republican lead was safe.
2002: Comparing September 30 Polls To November 5 Election Results
We only have September 30 polls for 2002, but it was the wildest last month of a Senate election in memory, as two races flipped after the Democratic incumbent left the ballot – scandal-plagued Bob Torricelli in New Jersey dropped out and was replaced by Frank Lautenberg, rescuing a race the Democrats were losing badly, while Paul Wellstone – who had a small lead over Norm Coleman in Minnesota – died in a plane crash, and was replaced by Walter Mondale, who completed his collection of losing statewide in all 50 states. Two other Democratic incumbents, Max Cleland in Georgia and Jean Carnahan in Missouri, lost after leading in the polls entering October; no Republican lost a lead. In Louisiana, I measured the polls and the 2-party vote with regard to Repubicans’ chances of forcing Mary Landrieu into a runoff (which they did, but then lost), as that was their goal that year. However, the 2002 Louisiana Senate race had the worst polling of any of the races I examined, and the “average” here is of one partisan poll from each side, with no public polling I could locate.
Note that, as in 2004 and 2010, and unlike 2012, 2008 and 2006, there was no overall move to Republicans – but the tight races broke consistently in the GOP’s direction.
What Does History Tell Us?
If we sum up the overall bottom line from these six races, a pattern becomes reasonably clear:
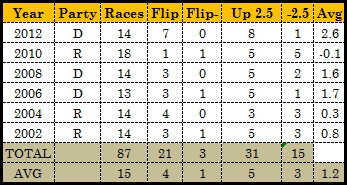
Which gives us this net result:
Out of 87 races, the poll leader in mid-September (counting Ford in 2006, since he was tied with a wave at his back) lost 24 of them, and 21 of those flips broke in the direction of the wave – an average of 3.5 gains and 0.5 losses per year for the wave party from where they stood in mid-September. 31 of 87 races moved 2.5 or more points (i.e., a 5-point or greater total swing) in the direction of the wave party, compared to 15 that moved 2.5 or more points against the wave party.
But recall that a lot of the big movement we saw was in races that were effectively decided by mid-September. We don’t care about a 5 point swing in this year’s Montana Senate race, and for the same reason we don’t care about races in the past where the poll leader in mid-September had at least an 8 point lead with the wave at his or her back, or in a very safe state. If we remove those races – and I admit that doing so introduces a bit of hindsight bias – we get 46 races. In 12 of those races, the wave party was ahead or tied in mid-September, and won 9 out of 12:
(I count the GOP as “leading” in 2002 against Landrieu because they were simply shooting to force a runoff and she was under 50; her actual poll lead over her nearest opponent was enormous, but she did end up in a runoff). Several of these races did tighten, while others, such as Texas in 2002, turned from a narrow lead into a rout – the wave party gained in 5 races, dropped in 6, and lost the one tied race and two of the leads, one of which (Doug Forrester leading Torricelli in 2002) was the result of a last minute change of candidate. The only actual blown lead was by Ken Buck. The other big dropoffs were voters in Montana “coming home” to the GOP in 2006, but not enough to save Conrad Burns, and Jim Bunning limping badly home in 2004 after having a big lead in a GOP wave year. Of the seven incumbents in these races, only two (Bennet in Colorado in 2010 and Burns in 2006) got noticeably more votes than their poll average in September.
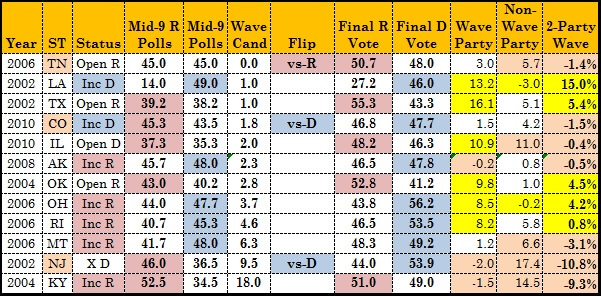
By contrast, we have a sample of 34 races where the wave party trailing in mid-September:
The wave party won 21 out of these 34 races, 10 of them against incumbents of the non-wave party. It gained in the 2-party vote in 25 out of 34, gained by 2 points or more (enough to wipe out a 4-point lead) in 18 races, and gained by 2.5 or more in 16 races. The wave party won nine races where it trailed by at least 3.5 points, eight where it trailed by at least four, five where it trailed by at least 6.5, and three races where it trailed by 9 points at this juncture. And of the ten races where the wave party overcame at least a 2.5 point poll deficit, six were against incumbents – not reassuring news for Kay Hagan or Mark Udall.
The overall trend here is not as overpowering as the historical trend disfavoring the Democrats in the Presidential race in 2016, and as I cautioned in that essay as well, there is never any guarantee that history will repeat itself. Strange things can and do happen in individual races after mid-September, as we have seen in those last six cycles. Republicans have proven themselves quite adept in recent years at coming up with novel ways to lose winnable elections. And even without big blunders, waves do not simply happen: capitalizing on them requires a lot of hard work from candidates, citizen activists, political professionals, and donors. But if 2014 follows the path of 2002, 2004, 2006, 2008, 2010, and 2012, we would expect to see between 53 and 55 Republicans in the Senate in 2015.